Titan Analytics
Instant market analysis without the hassle
Titan Analytics
Fast and defensible support for your market analysis


“Titan® Analytics is a great tool. It’s a one-step process. It posts the numbers of sales and listings right into the main heading of the report. This eliminates the hassle of counting the number of sales, getting the sales range, and doing the same for listings. Titan® Analytics does everything it needs to do. I like that it does the regression analysis and that it adds in the additional commentary. In fact, it analyzes the sales concessions and includes the amount of the concessions and ranges automatically. Anything that saves me time in a report is worth doing. Titan® Analytics is a definite time saver. There’s no question.”

Impressive charts for underwriters, reviewers, or private clients
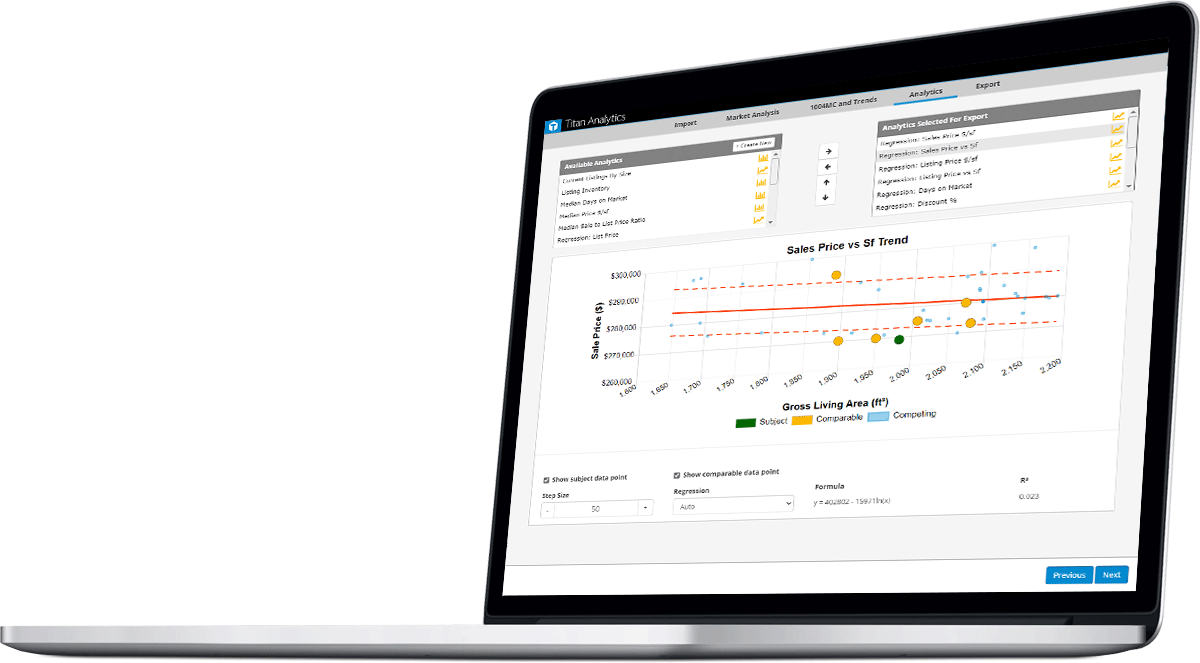
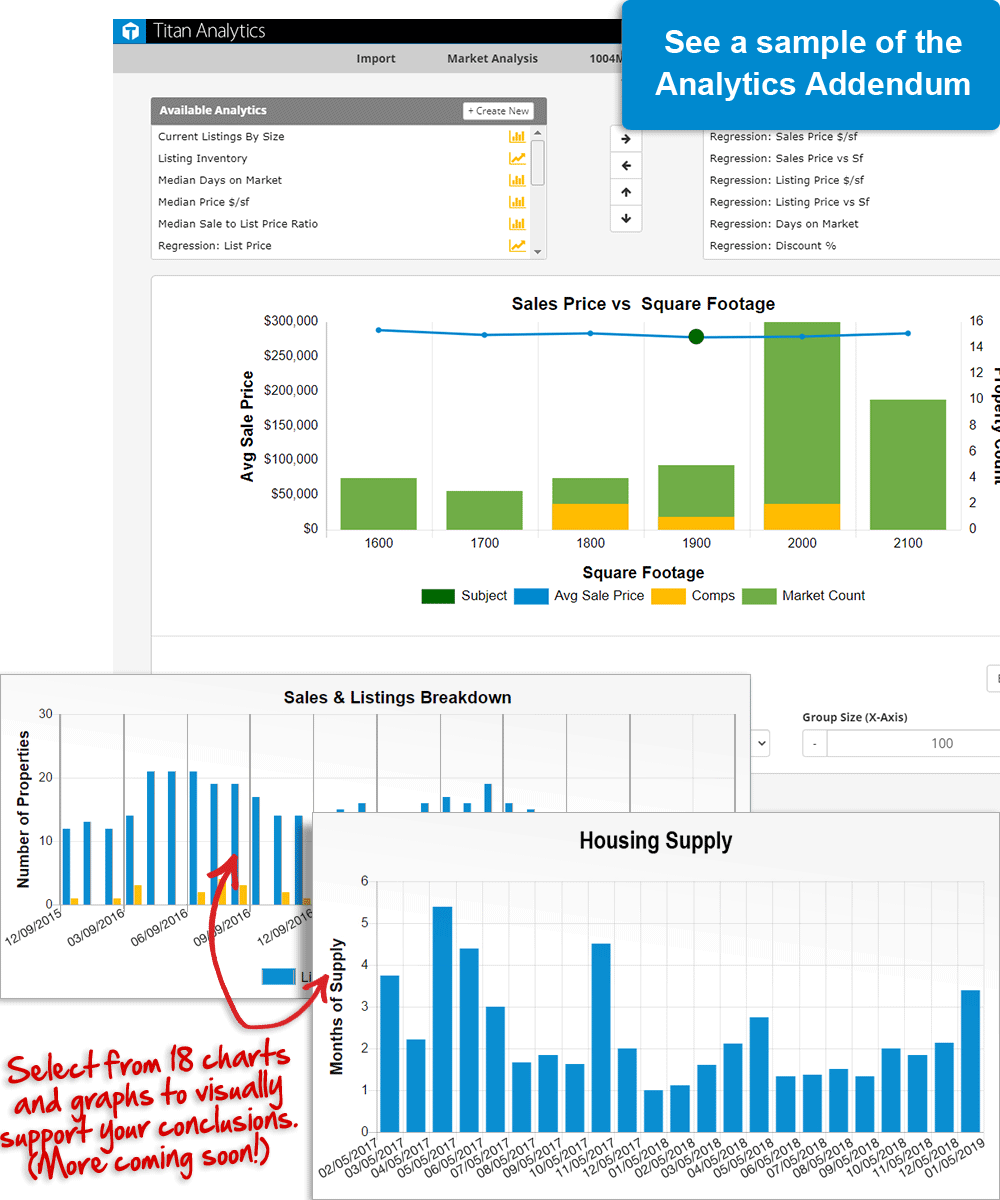
Are you tired of revision requests and questions about your comparable selections? They say a picture is worth a thousand words, so why keep trying to communicate market trends and statistical data with commentary alone? With Titan® Analytics, you can instantly show your subject and comps in comparison to your market. So, at a glance, your clients will see if your subject is bracketed and how your comps stack up. Plus, we've added new data points to trend with, such as the number of bedrooms, baths, and more. You can even create your own customized charts and graphs to help support exactly what you need, or pick from a host of detailed charts and graphs provided for you, including:
- Median Days on Market
- Regression: Sales Price $/sf
- Regression: List Price
- Housing Supply
- Sales and Listing History
- And many more
Everything you choose is placed into an Analytics Addendum in your report, describing visually to your clients the market elements that helped you reach your opinion of value.
Plus, all of your data — used and unused — gets added to TOTAL's Digital Workfile (which doesn't get sent to your client) as a CSV file. It includes the MLS data you imported and all of the relevant specifics — outliers, condos, latitude/longitude, what column it attributed to in the 1004MC grid, etc. That way, if you need to make revisions and recreate your analysis post-delivery, you can, in just a few clicks.
Click here to see a sample of the Analytics Addendum.
“I’ve been including analytics from Titan Analytics in all my reports.”
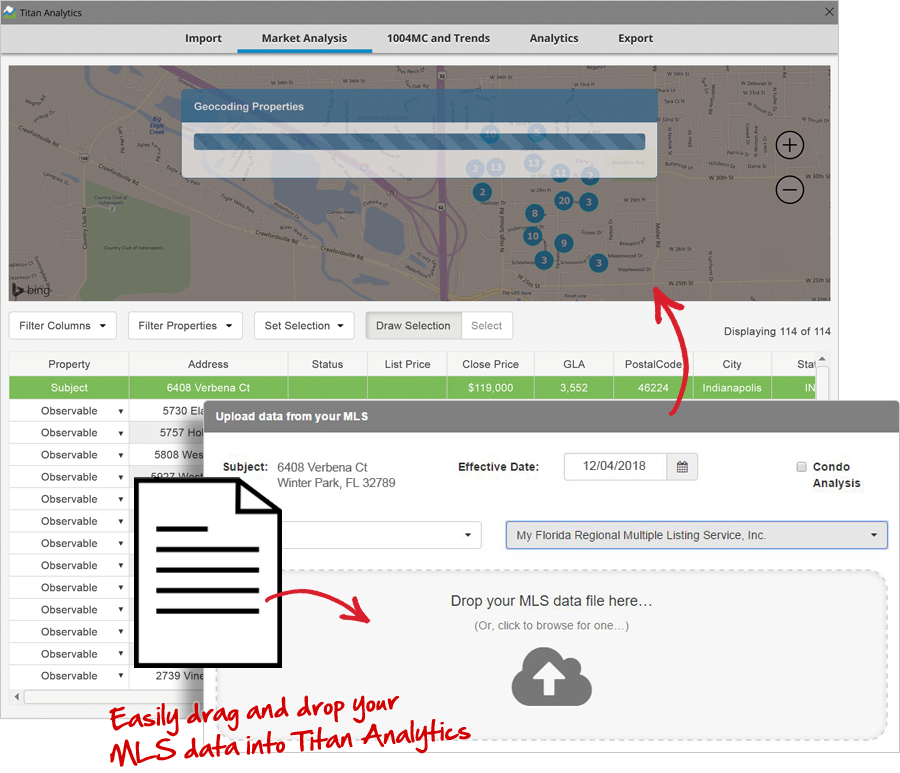
Drag and drop from any MLS
Any MLS that lets you export data (that would be all of them) works with Titan® Analytics. No need to search a vendor's list of compatible MLSs and coverage areas or pay for custom integrations.
Just export, drag and drop, watch our engine do its magic, and you're done. Plus, the integration with SmartExchange, let's you import UAD formatted peer data directly into your grid. Learn more.


Control which properties are included without editing spreadsheets
Sometimes properties that aren't in your market can make it into your MLS search results. Our automatic map and data grid make it easy to spot individual properties that don't fit, based on location, lot size, GLA, status, and so on. Click, they're gone.
It's in the tools you already use
It's available on any report in TOTAL or Titan® Reports, so you won't need to reinvent your workflow. And, we've made a lot of improvements directly from appraiser feedback. Leave the guesswork and communication breakdowns behind, and give your client's powerful insights into your analysis, no matter which form is required. Plus, there are a ton of free webinars and training options to help you hit the ground running, or to learn how to make your market analysis even more robust.
.png?width=1200&height=406&name=flawless-integration%20(1).png)
